Our camera set up consists of a tungsten lamp (we’re using tungsten because its spectral profile is an ideal, smooth, continuous curve) that emits light through a monochrometer, about 2.5 feet away. The monochromter splits the light and yields a narrow wavelength spectrum. This is the light we’re taking pictures of (and analyzing).
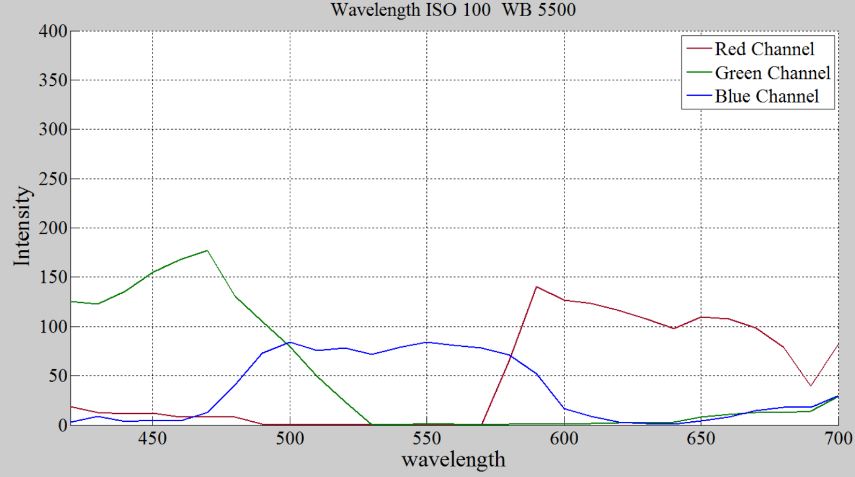
The data referred to in our last blog post was inaccurate because the test set-up was off and our camera settings (namely the focus) was off. After analyzing our data, and changing these settings, we were able to get good clean data (imaged with this blog). With our phone camera, we took 29 pictures of different wavelengths with the camera at ISO 100 and the white background at 5500. We started with wavelength of 420 nm and went to 700 nm. Using Matlab, we plotted intensity of each channel throughout these wavelength. As the result, we were able to identify the peak intensity for each channel. For our next step we need to get more data for each wavelength to be able to evaluate our data points using RMS.
This week, we began taking pictures with another camera–a Canon Power Shot. We had some trouble finding the right camera to use because we needed specific specifications from the manufacturer. We were also looking for a camera where we could manually change the ISO, shutter speed, and white balance, which this camera does. After taking the first set of pictures, we found that we will have to changes some of settings because it looks like the images are saturated.