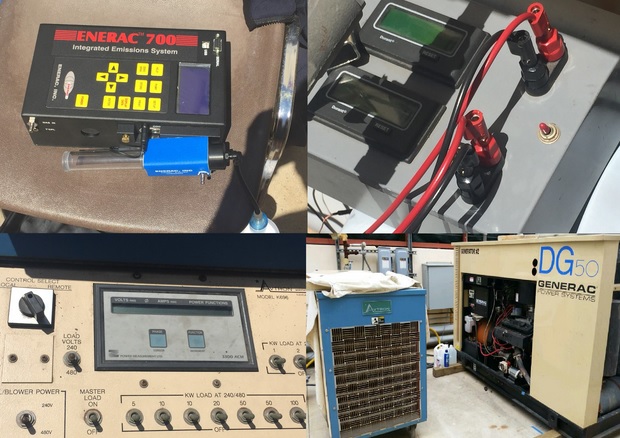
This week we accomplished a major milestone for this quarter by completing performance mapping associated with the engine/generator test bed. Running engine while varying the loads between 0-40 kW at increments of 10 kW, we recorded the emissions data for NOx and CO, estimated the flow rate of the natural gas entering the system, and calculated the engine efficiency. In particular, the Enerac 700 emissions sensor was useful in recording data because it could store information as well as print out emissions data on receipt-like paper for easy reading. In order to make the day as efficient as possible, Dani and Chris decided to split their respective responsibilities. Chris was responsible for measuring the emissions that came out of the exhaust holding the probe in place at the exit. Meanwhile, Dani helped measure the flow rate of the natural gas by recording the temperature, pressure, time, and pulses after every load change. Rich and Max helped with troubleshooting and set-up, and an APEP graduate student, Daniel, was in charge of recording and printing out the emissions data. After everything was finished, Katie organized the collected data into an excel spreadsheet and calculated the fuel input and efficiency. Additionally, Katie corrected the exhaust emissions to 3%O2 standard and graphed the NOx and CO levels vs. load to show the differing effects of load and fuel input on exhaust emissions and performance. As expected, at lower loads than the rated 50kW, the efficiency vastly decreases (exhibiting a range from 10 – 22%).
In the upcoming week, we plan to test our 3D printed Venturi Meter that now has pressure taps in order to verify the accuracy of our design.
By Katie Leong, Engine Test Bed