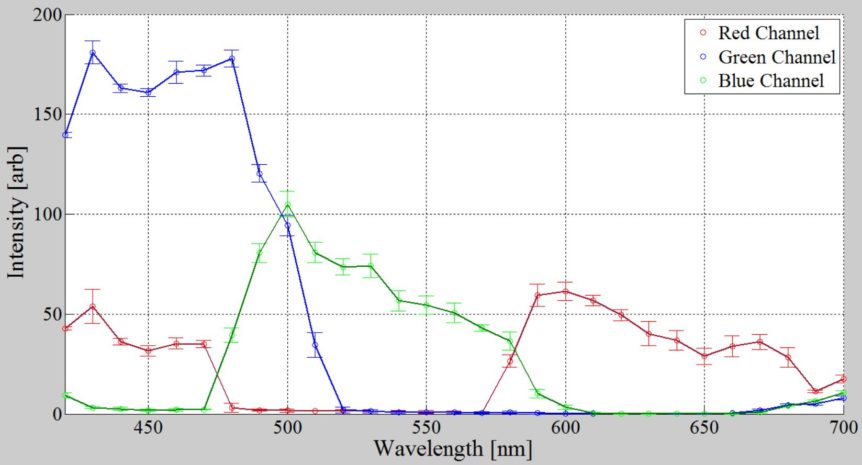
We wanted to find the error of our data using the root mean square (RMS), so we looked at 7 images for each data point in the graph shown, and separated the channels (RGB channels) and calculated the RMS using MatLab function. We eventually analyzed ~200 images, and found only a small error.
We have been preparing another test set-up with charcoal briquettes. We wanted to determine if charcoal briquettes would be a good test subject to take pictures of and analyze. So we lit a dozen briquettes and measured their temperature. After the charcoal stabilized and were entirely burning, we found the temperature on the outside of a briquette (taken out of the pile of burning briquettes) to be about 1100 – 1200 degrees Fahrenheit. Even blowing on it, the temperature stayed steady for about 20 seconds. And when we broke it up into pieces, we got a steady but smaller temperature, closer to 1100 degrees. After this raw test, we’ve decided to proceed with charcoal for our next test subject to take pictures of and analyze the images.