We are making good progress! We’ve accurately determined the temperature of our heating rod at different potentiometer settings with a type K, glass braided thermocouple. Our thermocouple is connected to an amplifier that converts the voltage (from the thermocouple) into temperature readings with an Arduino. With the glowing rod heated to 360 K and 953 K (the maximum temperature our thermocouple can read), we used a monochromater to find the wavelength (spectral) profile of the heated rod. We are applying this data to the Multi-Color Pyrometry Theory in order to create an accurate model equation for our analyses. We also took pictures of the heated rod at these temperatures and will use a Wolfram Alpha program to find the relationship between intensity of each RGB channel and temperature. We will then use that relationship to find values for the Multi-Color Pyrometry Theory.
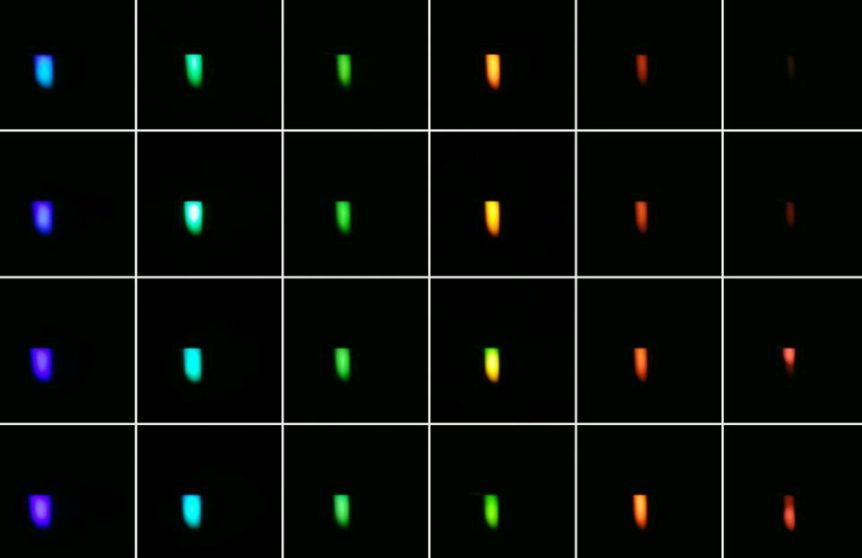
The image posted in this blog is a compilation of 25 images of light at from 420 to 660 nm in wavelength. We got these values with a monochromater and white light source and captured these images by changing the monochromater settings. These images will help us understand the boundaries of wavelength of the RGB channels. Basically we’re trying to find the peak of the RGB wavelengths.
We got a camera (similar to a GoPro) that we are currently “characterizing.” By that we mean we are going to find the ideal focus, shutter speed, and ISO to use as we take pictures of the RGB channels. In other words, we are looking for the settings at the “sweet spot” just before saturation.